
If the AI Boom Collapses, It Won't Be Because of Nvidia — Is SK Hynix the Global AI Infrastructure's Hidden Single Point of Failure?
Summary
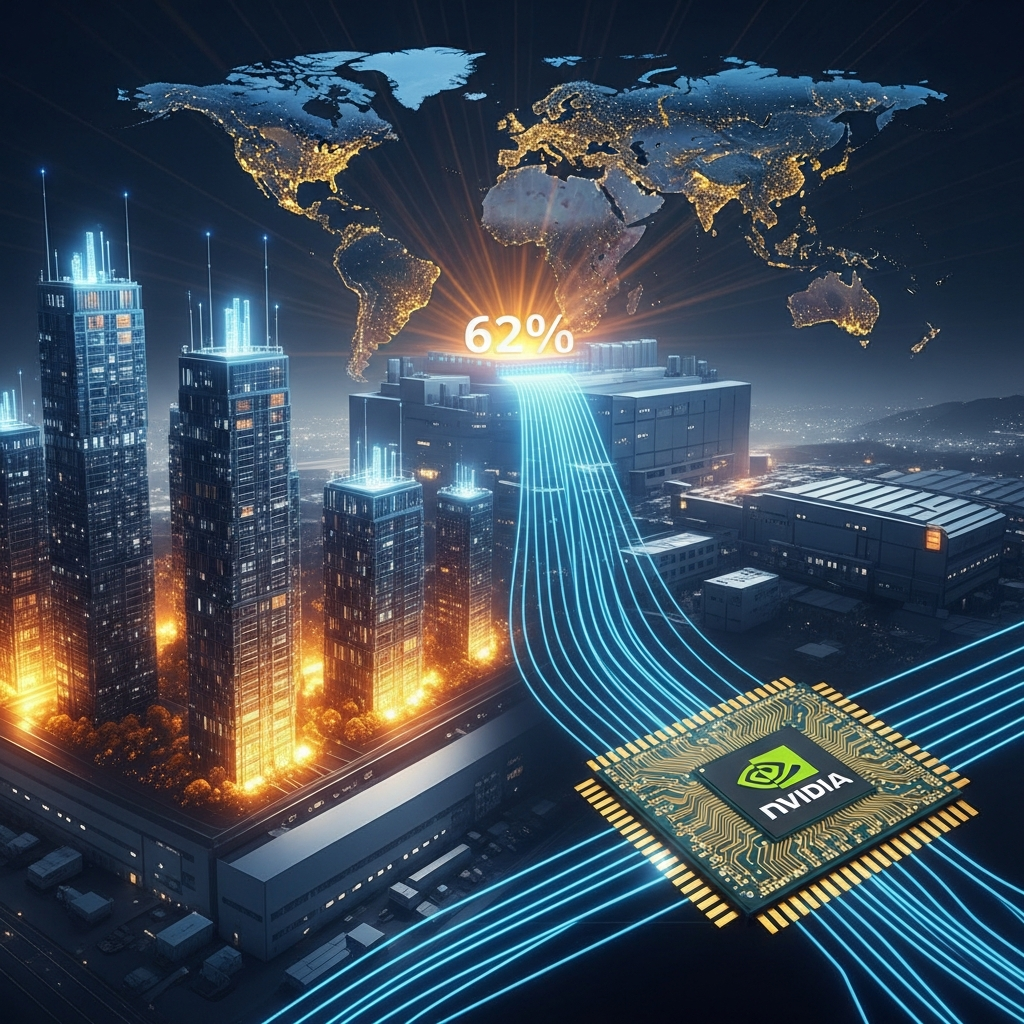
SK Hynix dominates the global HBM market with a 62% monopoly, becoming the critical bottleneck for global AI infrastructure. With operating profits of 4.7 trillion won and supplying 70% of NVIDIA HBM4 demand, the company faces the paradox of being simultaneously the greatest beneficiary and the greatest risk to AI's future.
Key Points
HBM Monopoly and Non-Cancellable Contracts
SK Hynix controls 62% of the global HBM market, more than Samsung (25%) and Micron (13%) combined. The critical fact is that 2026's entire HBM production is already fully pre-sold through non-cancellable long-term contracts. This represents an unprecedented level of demand visibility in the semiconductor industry. Unlike DRAM or NAND, which see 20-30% quarterly price fluctuations, HBM operates more like a subscription model with fixed pricing and secured long-term volume. The unique characteristics of HBM—vertical stacking technology, extreme yield management, and years of customer qualification—create entry barriers that maintain this monopoly structure. This competitive moat is unlikely to break down in the short term.
NVIDIA Strategic Partnership Deepening
SK Hynix supplies over 70% of HBM4 for NVIDIA's Vera Rubin platform. This goes beyond component procurement—it represents strategic partnership where NVIDIA optimizes entire system architecture around SK Hynix's HBM specifications from the initial design phase. HBM4 offers 50%+ bandwidth improvement and 30-40% ASP premium over HBM3E, structurally enhancing profitability. The accumulated joint development history and thousands of hours of compatibility testing create intangible moats that competitors cannot replicate quickly. Given that Vera Rubin's HBM4 allocation per unit exceeds Blackwell by 2x+, the strategic importance of volume securing is incomparable to previous generations.
47.2 Trillion Won Operating Profit—Historic Samsung Overtake
SK Hynix achieved 47.2 trillion won in 2025 operating profit, surpassing Samsung Electronics (43.6 trillion won) for the first time in Korean semiconductor history. The core driver is product mix transformation. SK Hynix rapidly shifted its DRAM portfolio toward high-margin HBM, now representing 40%+ of total DRAM revenue, while Samsung lagged due to HBM3E yield issues. HBM's operating margin is estimated at 2-3x higher than commodity DRAM. However, Samsung's organizational capabilities and 30+ trillion won annual R&D investment make permanent rank reversal unlikely. Fierce re-competition is expected in the HBM4 generation of 2027.
US ADR Listing and Valuation Re-rating Opportunity
SK Hynix is pursuing a $6.7B-$10B ADR listing. This transcends pure capital raising—it's a watershed moment for fundamental shifts in global investor perception. Currently trading only on KOSPI under a Korea discount, SK Hynix's P/E ratio trades at approximately half of TSMC's level. ADR listing would trigger structural inflows from global long-only funds and AI-themed ETFs. TSMC's precedent post-ADR listing showed valuation premium and global semiconductor ETF inclusion, driving structural demand improvement. Given HBM monopoly power and backlog certainty, the current discount appears excessive. Re-rating potential of 20-30% premium is plausible, benefiting existing KOSPI investors.
Memory Efficiency Technology—Structural Challenge
Emerging memory efficiency technologies like Google TurboQuant, quantization techniques, MoE architectures, and neuro-symbolic AI are rapidly advancing. If AI models can achieve equivalent performance with less memory bandwidth, the HBM growth equation breaks down. These technologies achieving industry-standard adoption within 2-3 years could bring the supercycle's peak earlier than market expectations. However, semiconductor history shows that efficiency innovations typically expand total demand rather than contracting it—Jevons paradox repeating itself. Memory optimization is more likely to moderate growth rates rather than reverse absolute growth trajectories. The critical variable for HBM demand sustainability remains a race between model expansion and efficiency gains.
Positive & Negative Analysis
Positive Aspects
- Dominant Technology Leadership
SK Hynix achieved the highest yield in HBM3E production and leads competitors by at least 6 months in HBM4 development. When NVIDIA designs new AI chip platforms, it optimizes entire architectures around SK Hynix HBM specifications—proving this technological advantage transcends manufacturing to ecosystem-level structural moats. Accumulated joint development history spanning years and tens of thousands of compatibility test hours represent intangible assets competitors cannot replicate in short timeframes. HBM4 demands 12+ layers of stacking requiring extreme thermal management and yield control—only SK Hynix has achieved stable mass production. Given HBM4's dramatically higher technical difficulty versus HBM3E, this leadership advantage likely persists 2-3 years.
- Pre-Sold Revenue Stability
The fact that 2026's entire HBM production is fully pre-sold through non-cancellable contracts provides semiconductor's strongest demand visibility buffer against inherent industry cycles. While commodity DRAM fluctuates 20-30% quarterly, HBM operates as a fixed-price, long-term-volume subscription model. This guarantees investors minimum 12-month sales and profit visibility—extraordinarily rare for semiconductor companies. 2025 already demonstrated quarterly beat patterns that structurally repeat in 2026. The framework enables consecutive earnings surprises, limiting downside risk while providing long-term investors stable holding justification.
- Global Capital Access via ADR Listing
Beyond $6.7B-$10B direct capital raise, ADR listing unlocks structural inflows from global institutional investors and AI-themed ETFs. KOSPI-only trading under Korea discount trap means P/E at half TSMC levels—excessive given monopoly power and backlog certainty. ADR listing bridges this valuation gap decisively while expanding US retail access with added liquidity premium. TSMC precedent post-ADR valuation re-rating and ETF inclusion parallels suggest SK Hynix 20-30% premium re-rating scenarios feasible, directly benefiting existing KOSPI shareholders.
- AI Supercycle's Most Direct Beneficiary
SK Hynix stands as AI's most direct structural beneficiary amid the megatrend of expanding model sizes per generation. HBM3E's 96GB-per-server deployment scales to 192GB+ in HBM4, with HBM adoption rapidly expanding to inference servers beyond training-only scenarios. Market's total addressable size (TAM) itself structurally expands as training-exclusive demand broadens to inference. Global HBM market estimated at 40-50 billion in 2027 versus 2025 baseline—2-2.5x expansion. As GPT-5, Gemini Ultra, and frontier models demand exponentially higher HBM volumes, SK Hynix maintains rock-solid growth momentum as AI's definitive 'picks-and-shovels' player.
Concerns
- NVIDIA Single-Customer Concentration Risk
NVIDIA's 50%+ share of SK Hynix HBM revenue creates classic customer concentration risk. NVIDIA's strategic options—material volume shifting toward Samsung/Micron or in-house memory development—could destabilize SK Hynix's premium positioning. NVIDIA's explicit principle of supply chain diversification, combined with evident motivation to reduce single-source dependence upon Samsung HBM4 yield improvements, presents real threat. Historical precedent of NVIDIA running parallel TSMC and Samsung foundry GPUs underscores strategic commitment to avoiding single-vendor lock-in. Competitive alternatives (AMD, Google TPU, Amazon Trainium) growth offers customer diversification opportunities while simultaneously pressuring NVIDIA premium pricing maintenance.
- Korean Peninsula Geopolitical Risk and Production Concentration
SK Hynix's HBM production concentrated in Korea's Icheon and Cheongju creates single-point-of-failure risk where 62% of global AI infrastructure simultaneously stops upon geopolitical escalation, natural disaster, or supply disruption. Contrast with TSMC's active dispersal to Arizona and Japan production facilities. SK Hynix lacks meaningful overseas HBM production infrastructure (NAND in Dalian, but zero HBM lines outside Korea). Korean Peninsula security deterioration, major natural disasters, or power supply disruption would carry exponentially greater impact than 2020-2021 automotive chip shortage, potentially delaying global AI development months. This geographic concentration risk fundamentally explains global investor application of Korea discount to SK Hynix valuations.
- Memory Efficiency Technology Demand Destructibility
Rapid advancement in memory efficiency—Google TurboQuant, quantization methods, MoE architectures, neuro-symbolic AI—structurally threatens HBM demand growth premises. If models achieve equivalent or superior performance with reduced memory bandwidth, per-server HBM allocation expansion trends reverse. 2-3 year standardization of efficiency techniques could bring supercycle peak far earlier than consensus anticipates. Strong economic incentives for AI firms to reduce GPU-per-training costs, with leading companies (OpenAI, Google) already deploying efficiency tech at scale, accelerates this trend. HBM demand sustainability ultimately becomes a race between model expansion and efficiency gains—SK Hynix investors must monitor this variable most vigilantly.
- Samsung and Micron's Aggressive Pursuit
Samsung pursued massive emergency investments to resolve HBM3E yield issues with concurrent HBM4 concurrent production goals. Historical semiconductor lessons show underestimating Samsung's R&D capability and 30+ trillion won annual capex is nearly always incorrect. Micron achieved NVIDIA HBM3E certification and receives tens of billions in CHIPS Act support, aggressively expanding HBM production capacity. Micron enjoys additional geopolitical premium as US company, amplifying US government supply chain localization strategy benefits. By 2027, HBM market enters fierce 3-way competition, weakening SK Hynix price determination power and margin pressure becomes inevitable.
Outlook
Looking ahead six months, SK Hynix enters a remarkably solid phase. With 2026 HBM production fully pre-sold, quarterly earnings surprises are likely through year-end. Q2 results (July announcement) prove critical—HBM4 mass production ramp's product mix improvement materializes numerically. HBM4's estimated 30-40% ASP premium over HBM3E means rising high-margin product share naturally improves profitability. Industry consensus projects 20-30% Q2 YoY operating profit growth; accounting for HBM4 ASP premium, upper-range 30%+ approaches realization. NVIDIA's Vera Rubin half-year launch volume directly reflects as SK Hynix revenue. Short-term internal share price pressures remain minimal. US ADR listing timeline represents another critical variable. The $6.7B-$10B scale listing transcends capital raise—it potentially transforms SK Hynix's global investor perception fundamentally. H2 2026 listing timeline or underwriter selection announcements become powerful share price catalysts. Domestic institutions already heavily positioned; global long-only funds and AI-themed ETFs haven't structurally entered. ADR announcement unlocks this institutional floodgate. US public market listing requires SEC review, accounting standards alignment, geopolitical risk assessment—6-12 months from announcement to trading commencement. I anticipate 2026 listing announcement, 2027 H1 actual trading commencement.
Sources / References
- SK Hynix 2026 Market Outlook — SK Hynix Newsroom
- SK Hynix HBM 62% Market Share Analysis — Astute Group
- SK Hynix HBM4 Monopoly Analysis — Financial Content
- Micron HBM Technology Development — Financial Content
- SK Hynix ADR Listing Analysis — TradingKey
- HBM Memory Boom 2026 — Rolling Out