
Micron Sold Its Own Ceiling — And a 7x P/E Is the Price Tag
Summary
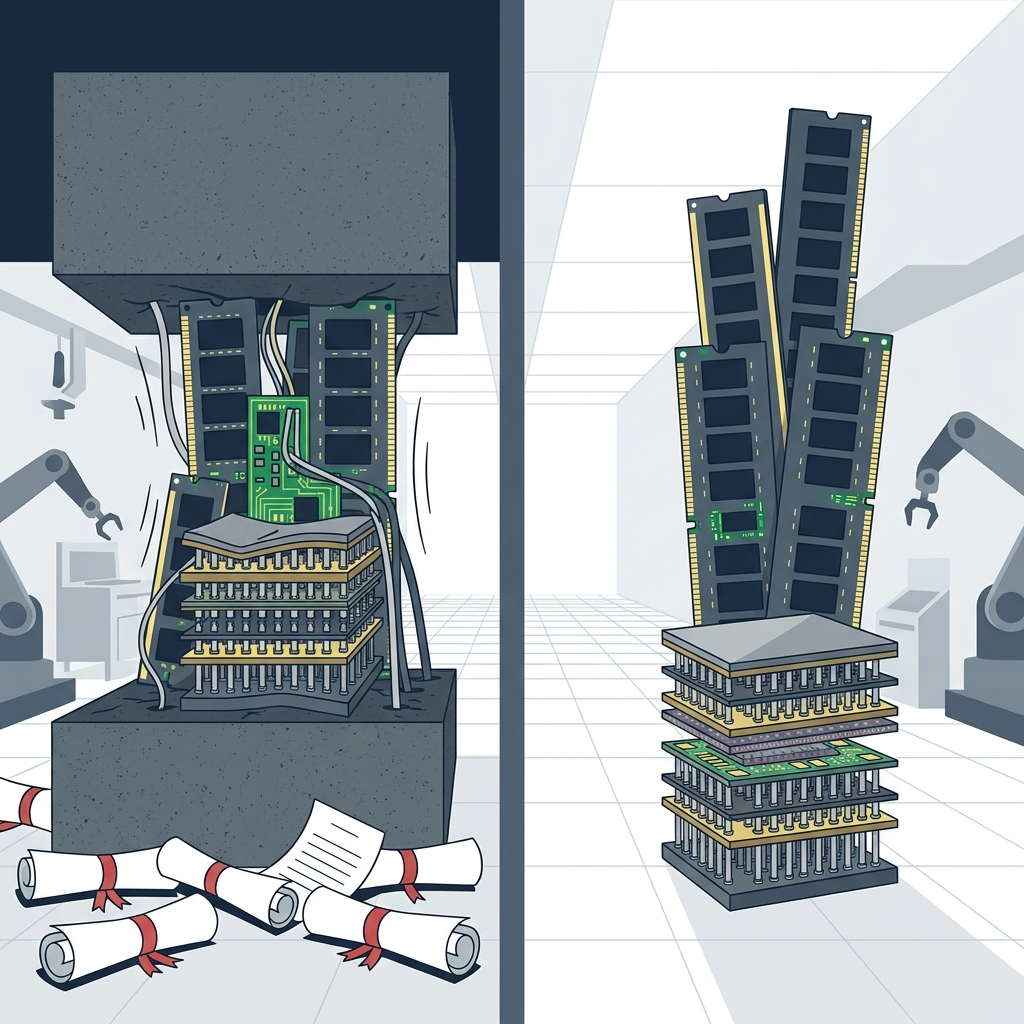
Micron Technology (NASDAQ: MU)'s Strategic Customer Agreements (SCAs) are running an unprecedented price-band experiment in the memory semiconductor industry — simultaneously setting a ceiling and a floor on chip pricing for the first time in the sector's history. The cumulative revenue at minimum prices over the remaining term of 14 out of 16 SCAs reaches approximately $100B, backed by non-cancelable, take-or-pay terms and nearly $18B in cash deposits already physically in Micron's hands. The ceiling is set near Q2 2026 (calendar year) market rates, capping upside during memory price surges, while management argues the floor guarantees gross margins higher than any peak quarterly margin from any past cycle. At an approximate current price of $1,075 and a forward P/E of roughly 7x on FY2027 consensus EPS of $156.53, the market appears to be pricing in the upper-tail profits structurally cut off by the ceiling — but may not yet be fully pricing the value of the lower tail that is also being cut. SK Hynix made the diametrically opposite call in the same AI boom, reportedly removing price caps from long-term agreements entirely, creating a natural experiment whose results will define memory industry contract strategy for years. With Q4 FY2026 earnings due September 30, the SCA disclosures — not the headline revenue figure — are the real data point that will confirm whether Micron's band model is actually working and expanding.
Key Points
SCA Price Band — The Memory Industry's First Revenue Structure Transformation
The Strategic Customer Agreements Micron signed with 16 major customers represent the first instance in memory semiconductor history of simultaneously establishing both a price ceiling and a price floor in a band-type revenue structure. According to the SEC 10-Q, the largest contracts set a ceiling near Q2 2026 (calendar year) market prices for existing products, with a floor holding through the entire contract duration. These agreements operate on a non-cancelable, take-or-pay basis, with $18B in cash deposits and over $22B in total financial commitments providing contractual enforcement weight. The cumulative revenue at minimum prices over the remaining term of 14 SCAs reaches approximately $100B, though this differs significantly from the GAAP RPO of approximately $5B — a gap attributable to contracts without price bands and post-quarter signings being excluded from RPO calculations. Currently, these agreements cover roughly 20% of DRAM volumes and about 33% of NAND volumes through 2030, with the full buildout of planned SCAs bringing approximately 40% of total revenue under band-structured pricing. CBO Sadana made clear that customers owe payment regardless of whether they take the product, confirming the contract's binding power goes well beyond a letter of intent. This experiment carries industry-level implications — the potential to strip away the cyclical discount that has defined memory semiconductor valuations for decades and convert a commodity business into something closer to a predictable infrastructure play.
The Structural Case for 7x P/E — Upper Tail and Lower Tail Both Cut
Micron's forward P/E of roughly 7x based on FY2027 consensus EPS of $156.53 is historically low even after a 276% year-to-date stock gain, and the compressed multiple has a structural explanation. About half of this discount reflects the market's judgment that SCA ceiling pricing structurally limits the upper end of earnings growth — a ceiling Trefis flagged in September analysis, noting that the stock trading at 12.7x revenue may be assuming more upside than the ceiling would allow. But what the market may be underweighting simultaneously is the fact that SCA floor pricing has also cut the lower tail of earnings. Mehrotra stated on the Q3 earnings call that even at floor prices, the contracts guarantee "a very robust gross margin for Micron, well above our peak quarterly margins in any past cycle" — and since the past cycle peak gross margin was approximately 61% in 2018, the floor represents a scenario where yesterday's ceiling becomes today's floor. Micron has historically gone to negative gross margins at cycle troughs, making a floor set above the prior peak a genuine structural transformation of the business's risk profile. A company with upper and lower earnings tails both cut looks less like a cyclical stock and more like a predictable bond, and a bond-like structure at 7x P/E represents potential structural undervaluation — provided the floor actually holds when tested.
Strategic Contrast with SK Hynix — Opposite Bets in the Same Boom
TrendForce's July 2026 reporting indicates that SK Hynix reportedly removed standard industry price caps from its long-term agreements, enabling spot market price increases to flow directly into contract prices at full rate. Micron sold its ceiling while SK Hynix reportedly eliminated its ceiling entirely — two diametrically opposed strategies coexisting in the same AI memory boom. This contrast isn't a minor contract-term variation; it's an expression of fundamentally different convictions about what comes next in the memory market. Micron's approach implicitly bets that this boom doesn't run indefinitely and that protecting the downside is worth the upside sacrifice; SK Hynix's approach bets the boom has further to run and maximizing current-cycle revenue is the right priority. With server DRAM contract prices up 13~18% quarter-over-quarter in Q3 2026, SK Hynix is pocketing that entire appreciation while Micron's SCA customers receive the equivalent rebate against the ceiling, and the revenue gap between the two strategies widens every quarter market prices stay above the ceiling. Following both strategies' outcomes over two to three years will produce real-world data on which contract framework better serves shareholders — making this one of the most consequential natural experiments in memory industry history, with implications that extend to every major player in the sector.
The GAAP RPO vs. $100B Gap — A Structural Disclosure Challenge
The SEC 10-Q discloses Micron's remaining performance obligation (RPO) at approximately $5B, while earnings call slides project approximately $100B in cumulative revenue at minimum prices over the remaining terms of 14 SCAs — a 20x gap that demands explanation and defines how investors value the SCA framework. The divergence exists because GAAP RPO as of May 28, 2026 excludes contracts without price bands, contracts signed after the quarter close, and other structural exclusions inherent to the accounting standard. The 10-Q itself states that the RPO disclosure is not expected to be an indicator of future revenues under these agreements, an unusually direct acknowledgment that standard financial metrics cannot capture the real scale of commitments. Reading $100B as confirmed revenue overstates the case; reading only the $5B RPO understates the true scope of SCA obligations. The $18B in cash deposits already physically received by Micron serves as the sole independently verifiable evidence of contract binding force within this gap — it's not an accounting construct, it's real cash that customers have already transferred. How investors interpret this gap sits at the center of Micron's valuation debate, and the direction of RPO movement in Q4 earnings will provide the first data point signaling which end of the range the true value gravitates toward.
Structural Supply Deficit — Why the Floor Won't Be Tested Anytime Soon
TrendForce data shows Micron can currently meet less than 50% of data center customer demand, with DRAM functioning as customers' number-one operational constraint ahead of power, land, and logic wafers — a fact that vividly illustrates the degree of supply-demand imbalance driving current market conditions. The 2026 DRAM fulfillment rate running at approximately -1% to -2% confirms persistent supply deficits, and new fab ramps delayed to 2028 mean the shortfall has no clear resolution for at least another year or two. HBM's DRAM wafer share climbing from 22% in 2026 to 30% in 2027 produces a crowding-out effect that further tightens conventional DRAM supply and reinforces price floors across the board. Global server shipments are projected to grow more than 17% year-over-year in 2027, keeping demand pressure elevated well into the medium term. This structural environment makes it extremely unlikely that SCA floor pricing needs to activate in the near term, as the scenario where memory prices collapse below floor levels keeps getting pushed further out — but this asymmetry also means ceiling costs are real every quarter while floor protection remains purely theoretical insurance. The supply deficit simultaneously provides Micron a favorable negotiating environment for signing additional SCAs on attractive terms before market conditions eventually shift.
Positive & Negative Analysis
Positive Aspects
- Unprecedented Revenue Visibility with $18B in Cash Deposits
The SCA structure provides Micron with revenue predictability at a scale unprecedented in memory industry history, with up to 40% of total revenue falling under price band structures that structurally improve quarterly forecast accuracy and reduce earnings volatility. The $18B in cash deposits already physically in Micron's hands provides tangible proof of contractual enforcement power beyond what GAAP metrics capture — it's not an accounting line, it's real cash already transferred. These deposits are back-loaded in terms of return timing, meaning Micron retains large cash balances early in each contract relationship and refunds them later, creating an effective interest-free funding advantage that benefits the company's liquidity position. Nine-month cumulative operating cash flow of $45.70B and total cash and investment assets of $30.2B represent the financial strength needed to sustain this strategy across a full multi-year contract cycle without stress. No prior memory company has paired multi-year agreements at this scale with deposit structures of this magnitude, making this a genuinely differentiated competitive advantage that is difficult for competitors to replicate quickly. The exit cost for any customer breaking an SCA is extreme — forfeiting the deposit means the contractual lock-in is not a soft commitment but a hard financial constraint that protects Micron's revenue base over the contract term.
- Structural DRAM Supply Deficit Creates a Favorable Signing Window
The 2026 DRAM fulfillment rate running at -1% to -2% and Micron meeting less than 50% of data center customer demand indicate a supply environment where SCA floor pricing is extremely unlikely to be activated anytime soon, while Micron's negotiating leverage for new contracts is at a structural high. New fab ramps delayed to 2028 mean this supply shortfall persists for at least another year or two without a clear resolution on the horizon. HBM's increasing share of DRAM wafer capacity — rising from 22% in 2026 to 30% in 2027 — creates a structural crowding-out of conventional DRAM supply that further reinforces price floors and keeps the market in deficit territory. Global server shipments projected to grow more than 17% year-over-year in 2027 maintain strong demand-side support that keeps customers motivated to secure supply commitments. During this structural supply deficit window, customer negotiating power is weakened and Micron has the favorable conditions needed to close additional SCAs on attractive terms before market dynamics inevitably shift toward equilibrium. The combination of supply scarcity and customer urgency to lock in supply creates the ideal environment for accelerating band coverage expansion toward and beyond the planned 40% of total revenue.
- Floor Pricing That Exceeds Any Prior Cycle's Peak Margin
Mehrotra stated on the Q3 earnings call that SCA floor prices are designed to deliver "a very robust gross margin for Micron, well above our peak quarterly margins in any past cycle" — a claim that, if verified, represents a structural transformation of Micron's downside risk profile. The past cycle peak gross margin of approximately 61% in 2018 serves as the historical reference point, meaning the floor is set above what was previously considered the absolute ceiling of memory sector profitability. The historical record shows Micron has gone to negative gross margins at cycle troughs, meaning the proposed floor represents an improvement of potentially 60 to 80 percentage points versus worst-case historical outcomes. If this floor holds in a real downturn, the traditional cyclical discount that has suppressed memory sector valuations for decades loses its primary justification and the entire valuation framework for the sector requires revision. A single validated instance of floor pricing protecting margins above historical peaks during a genuine down cycle could catalyze a sector-wide rerating as investors recalibrate their view of memory risk. The implication extends beyond Micron's own multiple to the entire framework investors use to value memory semiconductor businesses globally.
- HBM Technology Leadership Reinforces Customer Take-or-Pay Motivation
HBM4 mass shipments for a lead customer's platform and HBM4E volume production targeted for 2027 demonstrate that Micron's technical standing supports rather than undermines SCA customer motivation to honor their commitments. AI ASIC HBM capacity requirements expanding substantially over 2026 and into 2027 means HBM demand growth shows no signs of slowing, and customers need reliable access to cutting-edge memory technology from a viable long-term supplier — exactly what an SCA relationship provides. As long as Micron maintains competitive HBM capability, SCA customers have strong strategic incentive to fulfill take-or-pay obligations rather than forfeiting deposits and losing preferential access to constrained capacity that is genuinely difficult to source elsewhere. Advanced technology leadership and long-term contractual commitment create a reinforcing dynamic — contracts fund R&D investment, R&D sustains the technology lead, and the technology lead makes contracts worth keeping and renewing. This virtuous cycle has the potential to extend the durability of the SCA framework well beyond what purely contractual terms alone could guarantee, turning SCAs from simple supply agreements into something closer to strategic partnerships with bilateral dependency.
Concerns
- Immediate Opportunity Cost — Real Revenue Left on the Table Every Quarter
With server DRAM contract prices rising 13~18% quarter-over-quarter in Q3 2026, Micron is actively transferring that appreciation to SCA customers via ceiling pricing, while SK Hynix — with no ceiling — collects the full increase from its own customers. This isn't a future risk; it's money leaving the table in real time, every single quarter prices sit above the ceiling, creating a compounding gap between what Micron receives and what an uncapped structure would deliver. As SCA coverage expands toward 40% of total revenue, a growing share of Micron's business becomes subject to ceiling constraints, structurally lowering the average realized price versus what a fully uncapped portfolio would achieve in the current environment. Trefis warned in September that the stock trading at 12.7x revenue may be assuming more upside than the ceiling would allow, suggesting market expectations may be partially misaligned with the ceiling's actual constraints on realized revenue. In an extended bull market scenario lasting through 2030, the cumulative volume of foregone revenue from ceiling-capped contracts could become a significant drag on shareholder returns relative to competitors maintaining uncapped structures in the same favorable market. Every earnings call risks becoming a new iteration of the same familiar pattern — the ceiling prevented full upside capture, and the multiple discount requires explanation all over again.
- Untested Enforcement of Take-or-Pay in a Real Downturn
"Non-cancelable" in contract language is meaningfully different from "never contested in practice," and the memory industry at this scale and in take-or-pay format has never actually experienced a genuine down cycle under these contract structures. In other commodity industries, take-or-pay contracts have ended up in renegotiation or outright litigation when market conditions deteriorated dramatically enough to make honoring the contract economically painful for the buyer — and memory is not immune to that dynamic. Micron's SCA counterparties are large technology companies with significant financial sophistication and substantial negotiating leverage precisely because of their purchasing scale and alternative sourcing options. A severe memory market downturn is exactly the scenario where contractual commitments face maximum stress testing, and yet that test has never been conducted for SCAs at anything close to this level of magnitude or market coverage. The entire investment thesis resting on band model protection is ultimately an untested theoretical claim — and committing to a business model transformation on an unvalidated premise carries compounding risk if that premise proves faulty in practice. New fab supply ramps in 2028 could be the first moment this assumption faces genuine market pressure and receives its real-world verdict.
- Undisclosed Floor Levels Leave the Most Important Variable Unverifiable
Mehrotra characterized floor pricing as guaranteeing margins "well above" any prior cycle peak, but the actual floor price levels remain confidential competitive information not disclosed in any public filing, leaving investors unable to independently verify the central protective claim of the entire band model. Investors evaluating Micron's SCA framework have no independent means to verify what "well above" means in dollar or margin terms, how floor levels compare across different products or customers, or whether management's qualitative characterization accurately reflects the quantitative reality embedded in the contract terms. Outside of the approximately $5B GAAP RPO and the $18B in cash deposits, there is no external instrument through which the real protective power of floor pricing can be independently assessed or stress-tested by market participants. For an investment thesis that depends fundamentally on the floor working as described when it matters most, making the floor itself opaque to outside observers is the most structurally problematic design choice in the entire SCA framework. When management credibility comes under pressure — from disappointing results, competitive changes, or external market shocks — the undisclosed floor will inevitably become the primary focal point for skeptical market participants seeking to challenge the band model's validity. A guarantee you cannot verify occupies a meaningfully different risk category than a guarantee you can independently check.
- Historical Supply Cycle Patterns Create Structural Long-Term Risk
Memory industry history provides an unambiguous track record that deserves serious respect from investors: demand explosions lead to capital investment, capital investment leads to supply gluts, supply gluts crash prices, and crashed prices produce margin collapses at the producers — a pattern that has repeated with remarkable consistency over more than two decades. Motley Fool explicitly noted that history tells us that after these peaks, severe valleys often follow, and the statistical evidence behind that observation is not easily dismissed by even the most bullish structural argument. SCA floor pricing is specifically designed to interrupt this historical sequence, but its effectiveness against a full-scale market downturn has never been empirically demonstrated under actual adversarial conditions. Whether SCA customers — including large technology companies with multiple memory supplier options and strong financial incentive to minimize costs — will actually honor contractual volume commitments at floor prices when the entire memory market is in distress remains strictly theoretical and unvalidated. New fab ramps in 2028 will accelerate supply growth and create the conditions for the first genuine real-world stress test of Micron's floor pricing claims, potentially arriving before the market has fully priced in that risk. That test will ultimately determine whether the band model is a genuine structural innovation that changes the memory industry's investment profile, or a contractual structure that only works in the favorable half of the cycle when it faces the least resistance.
Outlook
The most immediate milestone is three days away — September 30. The headline numbers Wall Street will watch at Q4 FY2026 earnings are whether revenue hits the $50B ± $1B guidance and whether gross margins land around 86%. But in my view, the real numbers are elsewhere. The SCA disclosures are what matter. Specifically: how much has the RPO moved from the prior quarter's $5B, how many new SCAs have been signed, and what is the cumulative deposit collection status. If Q4 shows meaningful DRAM coverage expansion from the current roughly 20%, that reads as a signal the band model is growing. If RPO stagnates and no new contracts appear, it could be an early warning that customers are diversifying volume to ceiling-free competitors rather than committing to Micron's band structure.
Near-term supply dynamics remain strongly in Micron's favor. With the company able to meet less than 50% of data center customer demand, DRAM is functioning as customers' number-one operational constraint ahead of power, land, and logic wafers. Server DRAM contract prices rising 13~18% quarter-over-quarter in Q3 is direct evidence demand is overwhelming supply. In this environment, the cost of SCA ceilings grows every quarter. Every quarter market prices stay above the ceiling, the absolute dollar amount of revenue Micron foregoes increases. But simultaneously, this same supply shortage keeps pushing the scenario where SCA floors are tested further into the future. Near-term, ceiling costs are real and immediate; floor protection remains potential and deferred — that asymmetry will persist for the foreseeable future.
HBM4 shipment momentum also shapes the near-term outlook in meaningful ways. As of Q3, HBM4 (1-beta) is in mass shipment for a lead customer's platform, with HBM4E (1-gamma) volume production scheduled for 2027. HBM requires far fewer bits per wafer than standard DRAM, so as HBM's share of DRAM wafer starts rises from 22% in 2026 to 30% in 2027, the bit supply share climbs from 9% to 13% — but the gap between wafer share and bit share structurally crowds out conventional DRAM supply. This crowding-out effect reinforces conventional DRAM price floors, further reducing the odds that SCA floor pricing needs to activate in the next six months. As long as AI demand continues pulling HBM capacity expansion, the structural DRAM supply shortage remains intact and the floor stays theoretical.
The most critical medium-term variable is the 2027 DRAM supply outlook. TrendForce analysis projects global server shipments will grow more than 17% year-over-year in 2027, with DRAM fulfillment rates expected to remain in deficit. With new fab ramps delayed to 2028, supply won't catch up to demand for at least another one to two years. During this window, the opportunity cost of SCA ceilings keeps accumulating. The longer market prices stay above the ceiling, the larger the cumulative revenue gap between Micron and SK Hynix grows. But this same period gives Micron time to sign additional SCAs and expand band coverage on favorable terms — supply deficits weaken customers' negotiating position, and Micron can use that window to close more contracts before market dynamics shift.
The expansion path of SCA coverage is the central fork in the medium-term outlook. If coverage climbs from the current DRAM roughly 20%, NAND roughly 33% toward the planned approximately 40% of total revenue, Micron's earnings volatility structurally declines. If it pushes further toward more than half of revenue under SCAs as suggested in earnings call slides, the company becomes roughly half cyclical and half subscription in character. But wider coverage simultaneously amplifies the ceiling's constraint. If half of revenue is ceiling-capped while memory prices keep rising, the quarterly revenue divergence versus SK Hynix becomes increasingly visible in reported numbers. That trade-off will almost certainly spark shareholder debate, and management will face growing pressure to prove the SCA strategy's value in concrete, verifiable terms rather than qualitative characterizations.
Another medium-term variable worth watching is whether the US manufacturing premium factors into SCA pricing. According to TrendForce reporting, the premium for US-manufactured memory is already being reflected in SCA price-setting. Micron is executing large fab investments in Idaho and New York, and US production costs running higher than Asian alternatives is a well-established reality. If this premium is already baked into SCA ceiling prices, the effective ceiling could sit higher than Asian-market pricing — reducing the practical cost of the constraint. But from the customer's perspective, paying a US manufacturing premium within an SCA creates incentive to compare against Asian-sourced alternatives. Whether this premium accelerates SCA expansion or becomes a limiting factor will need to reveal itself in the next several quarters of results.
Competitive dynamics will also produce subtle but meaningful shifts over the medium term. Reports indicate SK Hynix has removed price caps from its LTAs, and Samsung is reportedly moving from one-year contracts toward three-to-five-year long-term agreements as well. All three memory giants are shifting toward longer-term contract structures while adopting structurally different pricing frameworks. Customers now evaluate Micron's ceiling-capped structure against SK Hynix's ceiling-free structure, allocating volumes based on stability versus flexibility preferences. For Micron to remain competitive, the differentiating value of floor protection and $18B in deposits needs to register as genuinely meaningful to customers — not just as an abstract hedge but as a reason to accept a ceiling. If customers don't see tangible value in a ceiling-capped contract, SCA expansion stalls and the band model fails to scale.
The 2028 to 2030 period is when the SCA band model faces its real test. Two scenarios diverge sharply. If AI demand continues on its current trajectory, memory prices even after supply normalizes in 2028 will likely remain above historical averages — in that case, SCA ceiling costs accumulate but floor protection is never activated, and Micron ends up paying insurance premiums without ever filing a claim. Alternatively, if the AI investment cycle decelerates around 2029, or alternative architectures like CXL or near-memory compute begin displacing HBM demand, memory prices could fall toward or through floor levels for the first time. That second scenario is when SCA's real value finally surfaces — and when the floor pricing commitment from customers gets its first genuine test against adversarial market conditions.
Looking at the widest frame, Micron's SCA experiment could signal a structural transformation for the entire memory sector. Memory semiconductors have historically been defined by high growth and high volatility — the cyclical characteristics that have permanently discounted their valuations. If all three major players move toward long-term contract structures that improve revenue predictability, the market may reclassify memory semiconductors alongside predictable infrastructure sectors like semiconductor foundries or industrial gases. That reclassification would produce a structural rerating — taking P/E multiples from single digits to double digits across the sector. Micron, as the first mover with the most developed band architecture, would be the primary beneficiary if this shift materializes.
Pulling the scenarios together: in the bull case, AI demand exceeds expectations and supply shortages extend beyond 2028, meaning SCA floor pricing never needs to activate. The $18B in deposits and take-or-pay security get recognized by the market as structurally eliminating downside risk, and the multiple expands as the bond-like earnings profile becomes undeniable. In the base case, supply and demand reach equilibrium around 2028, memory prices soften, and SCA floors activate for the first time — Mehrotra's claim that floors deliver margins "well above" the 2018 peak of around 61% gross margin gets tested against actual results. If it checks out, that represents a historically dramatic improvement versus past troughs and validates the band model. In the bear case, AI investment contracts rapidly and customers push for take-or-pay renegotiation, putting SCA's legal enforceability on trial in ways that will define or destroy the band model's credibility permanently. Investors watching September 30 earnings should track three specific SCA figures beyond the headline numbers: RPO movement, cumulative deposit collections, and SCA coverage ratio. These three data points will show whether Micron's band model is on track, stalling, or accelerating into the next phase of its existence.
Sources / References
- Q3 FY2026 Earnings Press Release (SEC 8-K EX-99.1) — SEC EDGAR — Q3 FY2026 Earnings Press Release (SEC 8-K EX-99.1)
- Micron FY2026 Q3 10-Q — SEC EDGAR — Micron FY2026 Q3 10-Q
- Q3 FY2026 Earnings Call Transcript — Investing.com — Q3 FY2026 Earnings Call Transcript
- SK Hynix Reportedly Removes Price Cap in Memory Long-Term Agreements, Diverging from Micron — TrendForce — SK Hynix Reportedly Removes Price Cap in Memory Long-Term Agreements, Diverging from Micron
- How Much of Micron's Revenue Has a Price Ceiling — Trefis — How Much of Micron's Revenue Has a Price Ceiling
- Up 275% This Year, Micron (MU) Is Still a No-Brainer Buy Before September 30 — 247WallSt — Up 275% This Year, Micron (MU) Is Still a No-Brainer Buy Before September 30
- Micron Can Meet Less Than Half of Data Center Demand as Customers Rush to Secure Memory at Very High Prices — TrendForce — Micron Can Meet Less Than Half of Data Center Demand as Customers Rush to Secure Memory at Very High Prices
- Micron's Operating Margin Surged Past 80% for the First Time — Motley Fool — Micron's Operating Margin Surged Past 80% for the First Time
- Micron locks in historically high memory prices for five years — The Register — Micron locks in historically high memory prices for five years